This post is one in a series of feature stories on trends shaping advanced energy markets in the U.S. and around the world, drawn from Advanced Energy Now 2016 Market Report, which was prepared for AEE by Navigant Research.

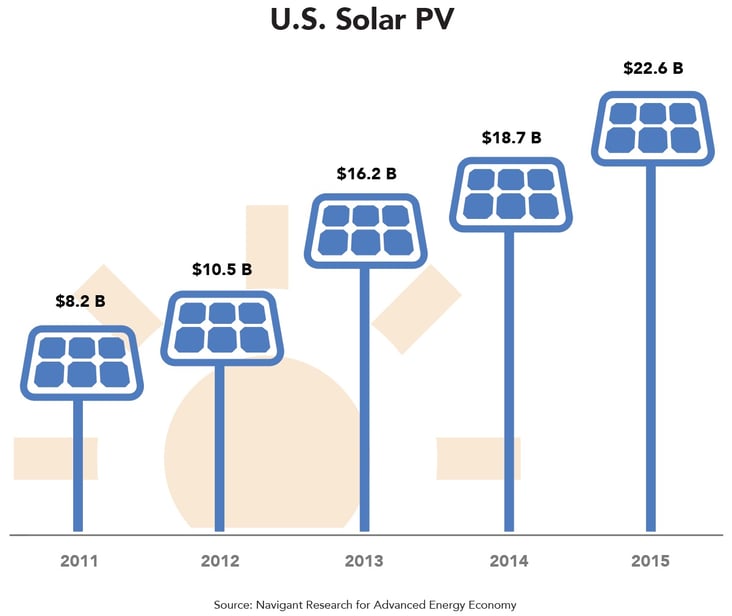
In a breakthrough year for the U.S. Solar PV industry, nearly 1 MW – enough to power more than 160 homes – was installed almost every hour in 2015. The cumulative solar PV installed capacity in the United States has now surpassed 27 GW. Revenue generated from installations of solar PV – across residential, commercial, industrial markets, and large utility power plants – reached an estimated $22.6 billion in 2015, a 21% increase over 2014, and growth of 174% since 2011. Plus, the industry got an extension of the federal investment tax credit, with a gradual phase-down, through 2023.
The combination of technology cost reductions, renewable energy targets at the state level, business model innovation, and federal tax policy has made the United States one of the top three solar PV markets worldwide. The challenge to the traditional utility business model, particularly from on-site solar, continues to result in skirmishes at utility commissions across the country. Central to the debate is how much distributed solar should be allowed to be net metered (sold back to the grid), at what price, and how costs are allocated across ratepayers. These battles notwithstanding, Navigant Research forecasts more than 70 GW of new solar capacity additions, both large-scale and distributed, between 2016 and 2022, potentially bringing the cumulative installations above 100 GW, four times the current installed base.
With roughly half of the country’s installed capacity today, California remains the leading state for solar PV installations. California is also home to rooftop solar companies such as SolarCity and Sungevity, as well as large-scale developers such as SunPower and Recurrent Energy. Arizona’s First Solar completed the 550 MW Desert Sunlight project in California – while other states, including Arizona, New Jersey, Massachusetts, and North Carolina, are experiencing strong growth as well.
While residential solar PV installed prices have dropped nearly 50% since 2010, large-scale costs are reaching record lows. Power purchase agreements (PPAs) for solar electricity supplied from a utility-scale solar farm have reached prices below $.05/kWh – competitive with wholesale power in most markets. In solar resource- rich states like Texas, future PPAs could go even lower. Also on the horizon is the growth in “community solar” programs, which offer a potential pathway for utilities and third-party providers to reach the millions of U.S. households that want to purchase solar power, but do not have adequate roof-space.
New global Solar PV installations reached an estimated 58.8 GW in 2015, including those in the United States, reaching approximately $113.9 billion in revenue – a 26% gain over 2014, and up 22% over Solar PV’s previous peak year of 2011. China led all markets with more than 17 GW installed last year, as the country’s most recent five-year plan calls for 200 GW of solar by 2020. Japan’s thriving Solar PV market continued to grow apace in the wake of the Fukushima nuclear disaster and with strong, though declining, nancial incentives. The United Kingdom and India continue to be strong markets as well, with an estimated 4 GW and 2 GW installed, respectively, in 2015.
Download Advanced Energy Now: 2016 Market Report from the link below:
