This post is one in a series of feature stories on trends shaping advanced energy markets in the U.S. and around the world, drawn from Advanced Energy Now 2015 Market Report, which was prepared for AEE by Navigant Research.

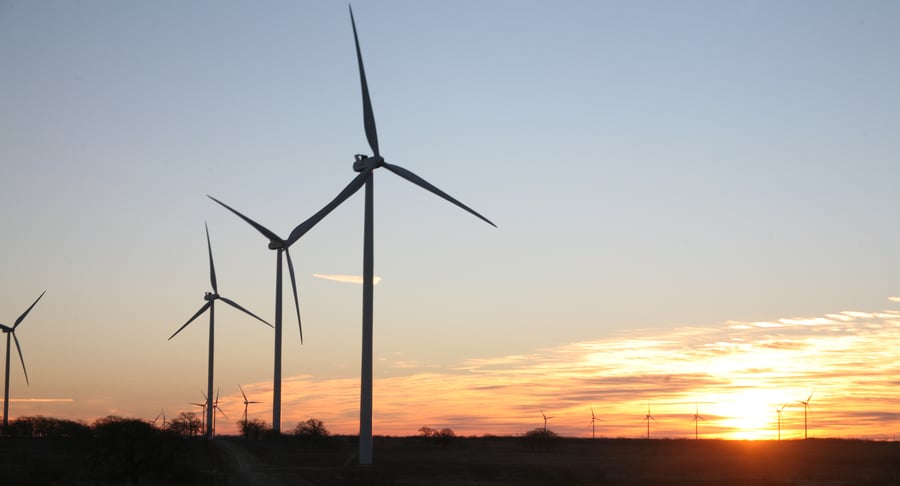
Photo courtesy of RES Americas.
China continued to deploy wind power at a remarkable rate, installing an estimated 23.3 GW in 2014, a 45% increase over 2013. China accounted for 45% of the 51 GW installed globally in 2014, representing $94.6 billion in revenue. This is the most wind ever installed by a single country in a single year, bringing China’s cumulative wind capacity to over 114 GW. For comparison, all of Europe installed an estimated 12.8 GW last year, representing modest growth over the 12 GW installed in 2013. It is very likely that the Chinese wind market will continue to post big numbers. The National Development Reform Committee’s wind power development roadmap calls for wind to account for 17% of China’s total electricity production by 2050. In order to reach this target, 200 GW of wind power will need to be installed by 2020, 400 GW by 2030, and 1,000 GW by 2050. China’s “Big 5” state-owned power producers have developed the vast majority of the country’s wind power to date and benefit from having the global manufacturing hub in their backyard. The top wind turbines vendors in China in 2014 were the same as last year, with Goldwind in the lead followed by United Power and Mingyang.
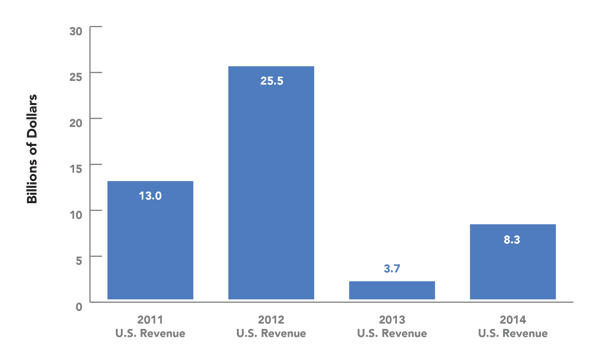
The U.S. wind power market recovered in 2014 from the severe setback of the year before. Approximately 4.8 GW of wind went online in 2014, representing $8.2 billion in revenue, up from just over 1 GW and just $2.1 billion in revenue in 2013, which was down from the 2012 peak of $25.5 billion. This brings U.S. cumulative capacity to 65.8 GW, and leaders are expecting more in 2015.
"We employ more than 500 people and that number is increasing, as 2015 is looking to be a healthy year for wind development in the U.S.," said Susan Reilly, President of AEE member company RES Americas. The company, which is based in Colorado, has been a wind project developer and builder for 17 years in the United States.
Wind Power

(Source: Navigant Research)
The rebound in 2014 was the result of the one-year extension in 2013 of the production tax credit (PTC) and investment tax credit (ITC). Flexible “commence construction” language allowed projects that began construction or spent at least 5% of expected capital expense prior to January 1, 2014, to be eligible for the credits. This provided for a recovery in the U.S. wind market in 2014 and sets the stage for a particularly big 2015, since over 12 GW of wind projects are under construction, which would nearly match the 2012 record of 13 GW of wind was installed.
Of the current 12 GW wind pipeline in the U.S., 10 GW is in Texas alone. The boom in Texas results from a confluence of factors: continuing rise in electricity demand, excellent wind resources, and completion of the Competitive Renewable Energy Zone (CREZ) transmission expansion. CREZ is a nearly $7 billion project that has brought online nearly 3,600 miles of new transmission capacity, accommodating over 18 GW of generating capacity. It is the result of a plan to coordinate the effort of wind developers with needed transmission expansion. Texas’s strong economic growth, abundance of natural gas to complement wind generation, and experimentation with energy storage make it a key state to watch in 2015 for how grid operators manage this mix of generation resources. The top wind turbine vendors in the United States in 2014 in order were GE, Vestas, and Siemens.
Europe is the leading market for offshore wind as massive and highly efficient 5 MW and 7 MW wind turbines are going up off the coast of Germany, the United Kingdom, and the Netherlands, though costs remain high as developers navigate harsh open sea environments. While onshore wind was a success story in the United States, offshore wind’s long awaited takeoff suffered a major blow in early 2015 with new and potentially show-stopping complications for the long-awaited 468 MW Cape Wind offshore wind development. The two major utilities that had agreed to buy the majority of Cape Wind’s output upon completion pulled out of their power contracts, citing the developer’s inability to secure financing and achieve contractually agreed upon construction milestones. The outcome is still uncertain pending legal disputes between the stakeholders but the prognosis is poor for the developer to revive the contracts and thus the project, at least in the near term
The on again, off again nature of the key PTC and ITC federal incentives remains a particularly difficult challenge for the offshore wind industry, which typically needs a longer lead time for development. In contrast with the United States, China already had nearly 600 MW of offshore wind operational by the end of 2014 and is expected to exceed 1.5 GW of offshore wind by the end of 2016.
Learn more about the size and growth of the wind energy industry, as well as the advanced energy industry as a whole, in our Advanced Energy Now 2015 Market Report.
